Predictive-policing-Chicago
Group project for the "Decoding Biases in AI" class at SciencesPo during Fall 2021. Lachérade, P., Szabo, B., Krikava, J. & Aeby, M.
View the Project on GitHub marquito95/Predictive-policing-Chicago
Predictive Policing in Chicago
Introduction
Policy makers nowadays are facing enormous challenges due to the scarce resources in law enforcement. For this reason, introducing data-driven approaches in already existing practices can help enhance proactivity in policing. We can use algorithms to track already existing patterns of crime, identify targets and the social networks of crime, which based on the findings, can potentially predict the expected outcome of the future. Overall, one would expect that such strategies would help prevent time and secure certain areas by reallocating human resources. Thus, it is no surprise that in a city like Chicago, which is particularly segregated, subjected to gang violence, and experiencing extreme crime rates, the police attempted to exploit the opportunities given by data science. In our project, we were focusing on the predictive policing algorithm used by Chicago Police Department (CPD) between 2013 and 2019 to identify potential participants in gun violence in the future by creating a so-called Strategic Subjects List (SSL) - often referred to as “the Heat List” - in which risk scores are allocated to potential participants of gun violence. As the CPD had to face several criticisms, due to inefficiency despite high costs, the lack of transparency, violation of human rights and potentially racial bias, the SSL system was quietly shut down. As Chicago’s demographic composition is rather diverse, in our report we aim to answer the following research question: Are individuals ascribed systematically higher scores based on their racial profiles and thus leading to a racial bias in the SSL system? To answer this question, we exploited the open data policy of Chicago, which provided access to the datasets that we needed. This gave us the opportunity to analyse the SSL score system thoroughly and look for accuracy and fairness in the algorithm. In the first part of our report, firstly we present our analysis in this report, following a brief overview of predictive policing practices, followed by the context of Chicago and circumstances of the “Heat list”. In the second part, we introduce our methodology, provide a descriptive analysis of the dataset and present our statistical analysis of the dataset.
Predictive Policing in Chicago
In our report we use the following definition to refer to predictive policing practices: “Predictive policing is the collection and analysis of data about previous crimes for identification and statistical prediction of individuals or geospatial areas with an increased probability of criminal activity to help developing policing intervention and prevention strategies and tactics” (Meijer and Wessels, 2019). When we are talking about predictive policing, computer scientists can rely on wide-range of academic literature in criminology. Tayebi and Glässer distinguish between five potential resources for predictive policing algorithms: co-offending network disruption, organized crime detection, suspect investigation, co-offence prediction and personalized crime location prediction (Tayebi and Glässer, 2016). These align with the already existing categories of analysis techniques used by police departments, that are: analysis of space, used to identify criminal hot spots in areas with higher likelihood of crime, time and space, used to include the temporal factor in crime analysis and social networks, which instead of focusing on location detection, it attempts to detect persons of interest (Bachner, 2014). Although the results of empirical research are ambiguous, and while some authors (Mohler et al. 2015) states that the predictive algorithm did help reduce crime rates, and better identify potential hotspots, while other authors (such as Hunt et al., 2014) argue that there was no significant reduction in crime thanks to the algorithm compared to the conventional law enforcement practices. Overall in crime reduction, as the evidence-based policing matrix by Lum, Koper and Telep shows, place-based crime strategies are found to be more effective than offender-based approaches, however, already existing approaches show that strategies tend to favour offender-based, reactive approaches (Lum, Koper and Telep, 2011). Based on research, currently dozens of US cities, such as Los Angeles, Oklahoma, Elgin, Richmond, Santa Cruz apply the predictive policing algorithm called PredPol all over the US. While some of them are open about it, many do not reveal information about their practices. This is a location-based algorithm which gives hints to the police to patrol or surveil specific areas more heavily predicted by the algorithm (Haskins, 2019). However, in many cases, such algorithms are often shut down due to public discontent. According to a local activist in Los Angeles, the LA Police Department was using both location-based (PredPol) and individual-based policing algorithms (Operation Laser), and when the list of identified targets was revealed, it contained predominantly (90-95%) black and brown people. Eventually both projects were shut down in 2019 and 2020, as the inefficiency, inherited bias and public discontent increased (Ryan-Mosley and Strong, 2020). At the same time, while certain companies, including PredPol, or Keystats and HunchLab have contracts with police departments all over the country, New York PD has chosen to build its own predictive policing system, based on already existing criminal data (Díaz, 2021). Nonetheless, in many cases, the data that the algorithms are fed on are usually hard to obtain and the mechanisms are non-transparent (Heilweil, 2020). Besides Los Angeles and New York, the most important frontrunner of using predictive policing algorithms was the Chicago PD, which used an algorithm developed by the Chicago ITT to analyze past arrests for violent crime, weapons offenses or narcotics, age and most recent arrest, trend line of criminal activity etc. (Ferguson, 2017). Overall, automation of predictive policing by using algorithms has been favoured by many cities and police departments, due to its efficiency and more objective nature to make decisions than humans, thanks to machine learning (Heaven, 2020). However, the objectiveness of these have been contested several times, as algorithms can perpetuate already existing biases.
Controversies around predictive policing:
Most of the predictive models are mainly data driven instead of theory driven, which means that it puts too much emphasis on correlations, instead of causality. Without properly understanding the deficiencies in already existing conventional policing methods, one can easily come to false conclusions. Furthermore, it poses accountability problems and it becomes unclear who is responsible for decision-making when there is full reliance on predictive algorithms. For this reason, we can argue that predictive policing algorithms can only serve as complementary to the conventional methods. It can also lead to stigmatizing individuals and groups and concerns regarding privacy and ethics, as many times, the personal data of the potential offenders are published, or their enhanced surveillance poses a threat on individual liberties and freedom (Meijer and Wessels, 2019). Furthermore, input datas might not be free from human biases and the outcome can lead to misuse of the data and biased behaviour. In practice, police often tend to arrest more black people, or individuals from other minority groups. If we are talking about location-biased algorithms, the algorithm will be redirecting police officers towards those neighbourhoods resulting in over policing in those areas, and potentially underpolicing in other parts of the city (Heaven, 2021). The empirical research also underlines this claim, as a group of researchers were trying to reveal these biases, and they have found significant discrepancies. In areas with low-crime rate, the algorithm only reported 20% of the hotspots, while in neighbourhoods with high crime rate, it overestimated the number of hotspots (Akpinar, De-Arteaga and Chouldechova, 2021). At the same time, in many cases, the Police Departments do not have the capacity or the expertise to understand how the algorithms work. Oftentimes, they keep purchasing it, without having background knowledge, which leads to the fact that several algorithms were trained with data from outside of the US, such as Canada or European countries, where the proportion of black population is significantly lower. This undermines the claim that the main problem with predictive policing is the data that the algorithm is based on, especially when racial biases in conventional arrests are pre-existing (ibid.) To conclude, we can see that predictive policing algorithms are far from being perfect, and still provide a lot of ground for biases and unbalance, which has serious consequences for the future. Overall, the lack of transparency that surrounds these algorithms can lead to enhanced distrust, and the over policing can lead to unfair arrests and aggravate the assaults on minorities.
Context of Chicago
The City of Chicago is located on Lake Michigan, in Cook County, in northeastern Illinois.
Crime rate is really high and has increased over the past year, especially the gun violences.
In order to try to reduce the criminality in Chicago, there have been policy initiatives to try innovative tools in order to tackle the insecurity issue in the city.
As stated by Tayebi and Glässer, using these mechanisms can lead to enhanced decision making processes, especially that co-offending networks have been particularly important when analyzing criminal patterns (Tayebi and Glässer, 2016). The Chicago Police Department also used this idea to implement their predictive policing strategy, which was highly inspired by the work of Papachristos and his colleagues, who focused on the sociology of criminal networks (Saunders, Hunt and Hollywood, 2016). The Strategic Subject List is created by the Illinois Institute of Technology, it was funded through a Department of Justice Bureau of Justice Assistance grant. The overall goal of the algorithm is to create a Risk Assessment Score - SSL (strategic subject List). The idea behind this score is to assess an individual’s probability of being involved in a shooting incident either as a victim or an offender. Scores are using a scale ranging from 0 (extremely low risk) to 500 (extremely high risk). To build this algorithm, the Chicago Police Department (CPD) collected data on all arrested people in the prior four years. The algorithm isn’t public but we can find a version of the list (the database we used) in the open data portal of the City of Chicago. This list has been anonymised. The Open data policy of Chicago was put as a priority for the development of the city since 2012 and is nownow quite developed (Open data portal and github page).
Part II: Researching bias in the dataset
First analysis
Methodology
This chapter describes the methodology for the research for a possible bias in the predictive policing algorithm. Most of the data was accessed through the City of Chicago’s data portal, which has an extensive open data policy. For the bias analysis we used three datasets: (1) Historical data about the SSL, (2) Real shooting incidents data and (3) Estimated demographical data per Police District. The first two datasets were directly imported from the City’s data portal using the Socrata Open Data API. The third dataset served as a proxy to approximate ethnicity in the actual shooting incidents, in which ethnicity is not specified. Because of the strong ethnic segregation of the City of Chicago, the research was focused on racial biases in the SSL dataset and is the reason why demographic data was needed. This is why in the third dataset, an estimation of the demographics per police district was done manually using demographic data on community area level and the mapping of police districts. The proportion of community area territory under the responsibility of given police districts was estimated, which formed the basis to calculate demographics per police district. The three datasets were cleaned into a suitable format for the bias analysis. The bias analysis was structured into two parts. Descriptive statistics of the SSL data were analysed with a focus on ethnicity. This formed the basis for a more in-depth analysis of the bias, where the SSL score was compared to actual shooting incidents on police district level to assess the accuracy of risk predictions per race. The analysis was performed on police district level, because data about shooting incidents per race is not available and thus the demographics of a police district can be used as a proxy for analysis. The district-level analysis was done in three steps: Ranking the districts according to respectively average SSL score and shooting crimes rate Creating racial profiles per police district and sorting the districts according to ethnic majority Comparing the racial disparities between district rankings While this methodology is rather approximate due to the limited availability of data, it does give some indications on how the predictive policing algorithm might have been biased.
Analysis of descriptive statistics
The algorithm computed the SSL score using eight variables, which are provided in the SSL dataset. For this reason, an OLS regression was performed to understand the approximative relative weights of the eight predictor variables:
 ]
]
Figure 1: SSL algorithm variables multiple regression
As shown in Figure 1, the younger an individual, the higher his or her SSL score.Whether an individual has been in the past victim of battery, assault or of a shooting are also important predictors in the algorithm. Therefore, age and whether the individual was a victim in the past played an important role in the algorithm. The algorithm resulted in the computation of a mean SSL score of 279.8 out of a scale of 500, where 0 is no risk of being involved in a shooting and 500 is the highest risk. The distribution plot in Figure 2 shows that most individuals score around the average.
 ]
]
Figure 2:Distribution of SSL score in the dataset
After having gained a better understanding of the predictor variables used and the score itself, a focus on ethnic data (which was not used in the computation of the SSL) is taken. The boxplot in Figure 3 indicates that most ethnic groups score similarly in the SSL. It only indicates a slightly lower SSL for Whites and a slightly higher average score for Blacks. These differences seem however marginal.
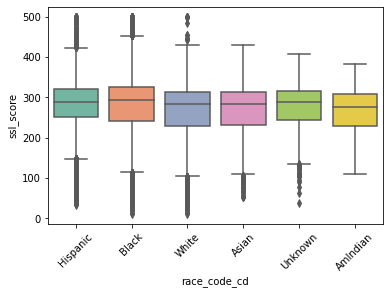
Figure 3: SSL score based on race
We then compared the number of subjects in the dataset by race. As visible in Figure 4, we found that there are very few Asians, American Indians, and racially Unknown subjects, so we decided to rule these categories from the rest of our analysis and only focus on Black, White, and Hispanic subjects.

**Figure 4: SUbjects in the SSL dataset by race
Furthermore, plotting a scale-adjusted distribution graph with the KDE-Method (Figure 5) shows that the three biggest ethnic groups (Blacks, Whites and Hispanics) have similar distributions. The Hispanic group however, does indicate a slightly smoother distribution around 215 compared to Blacks and Whites.

Figure 5: Distribution (scale-adjusted) of SSL score among races
The descriptive analysis thus did not yield conclusive results regarding a potential racial bias in the SSL. Having observed slight disparity between the scores of the three largest race groups (Blacks, Hispanics, Whites), we used statistical analysis in the next chapter to determine whether these differences are significant and should be examined further.
Statistical analysis
Having observed slight disparity between the scores of the three largest race groups (Blacks, Hispanics, Whites), we used statistical analysis to determine whether these differences are significant and should be examined further. Running an OLS regression analysis (Figure 6) revealed that race played a statistically significant role in determining the SSL score of a subject for Blacks (extra 13 points) and Hispanics (extra 14 points). On the contrary, race played no role for the score of Whites, showing a large disparity compared to Blacks and Hispanics.

uFigure 6: OLS regression for SSL scores and race
We further examined the importance and statistical significance of race in determining the SSL score through various statistical tests. All of them confirmed that the differences between the scores of Blacks, Hispanics, and Whites were statistically significant (example of the Anova test of statistical significance of inter-race differences in Figure 7).

Figure 7: Testing the significance of the inter-ratial SSL score differences
However, despite observing large and statistically significant differences between the SSL scores of different races in the dataset, there was no clear proof of a bias in the algorithm. The results could merely reflect the real-world situation in which Blacks and Hispanics could participate in more shooting crimes than Whites. To determine whether this was indeed the case or whether the algorithm was unfairly biased (i.e., “racist”) in assigning different scores to subjects based on their race, we decided to conduct a thorough in-depth analysis comparing real-world shooting crime data for different races and the risk predicted for them by the algorithm.
In-depth analysis
Methodology
Objective: We aimed to use the findings from the SSL dataset regarding the risk of being involved in a shooting crime for different races and compared this risk with real-world shooting crime data. By comparing the predicted and real risk, we would be able to assess whether the algorithm displayed signs of a racial bias.
Problem: Nevertheless, although real-world data about shooting crimes in Chicago were publicly available, the racial profile of the perpetrators and the victims were not. It was thus impossible to make the comparison of predicted and real risks.
Solution: To overcome this limitation, we decided to use a proxy for real-world shooting crime data clustered by race - combining crime data per district with district demographics data. These datasets allowed us to assign each district a majority racial profile and assess its ratio of shooting crimes per 10 thousand inhabitants, combining the results to see the real-world risk of shooting crime for districts based on their racial profiles. Since the SSL dataset could be clustered by district, we could achieve a representative comparison of real and predicted risk of shooting crime for different races.
Analysis
To compare the real and predicted risks of shooting crimes, we proceeded in three phases. In the first phase, we created a ranking of districts based on their mean SSL scores Followingly, we merged the real-world crime and demographics datasets and created another ranking, ordering the districts based on shooting crimes per 10 thousand inhabitants (Figure 8)

Figure 8: Rankings of district based on SSL score and criminality per 10k people
Observing the result, the ranking order predicted by the SSL algorithm was clearly different from the real-world ranking. To understand whether the differences were different for Blacks, Hispanics, and Whites, we introduced the racial aspect into this picture in the second phase. Not having access to racial data for police districts, we mapped demographic data for the smallest available units - community areas - and manually assigned them to the districts they were part of. Computing how many people of each race live in each of the districts, we could determine which race forms the majority of inhabitants in the given district. Districts were found to be heavily segregated with one race constituting above 60% of their inhabitants in all cases apart from district 17. To denote this, we added dummy variables for black majority (9/22 districts), hispanic majority (5/22 districts), and white majority (8/22 districts) into our merged ranking dataset (Figure 9).

Figure 9: District rankings with racial majorities
Results
Finally, in the third phase, we compared the disparities between the predicted and real-world risk rankings based on the racial profiles of the districts. Assessing the mean difference between the predicted and real-world rankings for each race, we found that the risk of shooting crimes in white districts was generally accurately predicted, missing only by -0.875 places on average. However, predicted risk was heavily overestimated for hispanic districts, missing by -5.4 places on average compared to the real-world risk ranking. Predicted risk for black districts, on the other hand, was significantly underestimated, missing by 3.78 places on average compared to the real-world ranking. To confirm the results, we ran OLS regression analyses to assess the statistical significance of the impact having a predominantly black, hispanic, or white population in a district. The results confirmed the previous results. It showed that having a white majority in a district was correlated with only a small ranking disparity (-1.38 places). Having black majority was correlated with a significantly decreased predicted risk compared to the real-world risk (6.39 places) and having hispanic majority was correlated with a predicted risk significantly higher than the real-world one (-6.99). Nevertheless, due to the limited observations in the dataset (22 districts in total) only the result for black districts was statistically significant (0.425). The statistical significance for white districts was extremely low (0.68) and the statistical significance for hispanic districts was close to significance (0.054), yet insignificant.
Next, we clustered the districts into five categories based on their positions in both SSL and real-world risk rankings to be able to analyze the accuracy of the risk predictions. The first four districts in each ranking were clustered as “extreme” risk, the next four as “high” risk, the next four as “medium” risk, the next four as “low” risk, and the final five as “negligible” risk. We then assessed whether the predicted and real-world risk clusters matched using a confusion matrix (Figure 10). We found that the overall accuracy of the predictions to be fairly low at 36.4% (8/22 districts). For white districts, the accuracy was high and satisfactory, totalling 75% (6/8 districts). However, the accuracy for hispanic districts and black districts was very low, at 20% (1/5) and 11.1% (1/9) respectively. These accuracy results confirmed the previous findings showing the disparities between accurate risk predictions for white districts as opposed to mistaken predictions for hispanic and black districts.
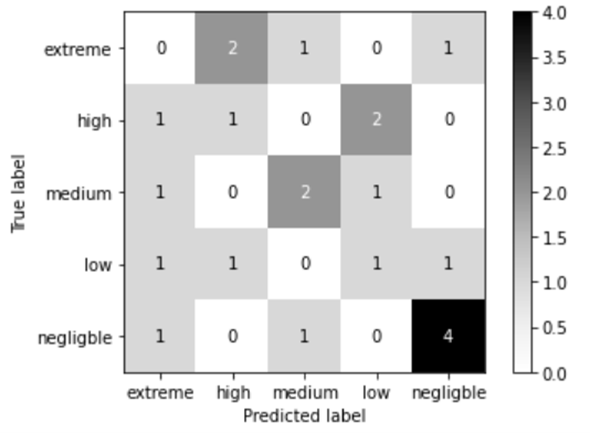 Figure 10: Confusion Matrix for the SSL algorithm
Findings and discussion
Overall, the findings of our analysis point in the direction of the SSL algorithm being racially biased, predicted inaccurate shooting crime risk scores for different races compared to the real-world data. However, the character of this assumed bias was surprising. Unlike some of the predictive policing algorithms which have been criticised to discriminate against black people, the SSL algorithm seems to discriminate black people positively, highly underestimating the risk they would be involved in a shooting crime. Conversely, it discriminates against hispanic people, significantly overestimating the risk they would take part in a shooting crime. For white people, the algorithm seems to be more or less accurate.
These results are of course preliminary and a deeper analysis with full data about the algorithm and the demographics of real-world shooting crime participants is necessary to confirm the said bias. Nevertheless, the implications of our findings are clear, novel, surprising, and statistically significant, and the assumedly discriminative nature of the algorithm is worth being examined. The causes of the bias are outside the scope of this analysis and need to be developed further to provide an explanation for the possible bias. One possible explanation would be to look at age which, as shown in Figure 1, is the most impactful variable in the algorithm (highly positively correlated with the SSL score). We found hispanic population in the SSL dataset to be significantly younger than black or white populations (Figure 11), which could explain why the predicted risk score of Hispanics was significantly overestimated compared to the real-world risk. Nevertheless, this remains a mere hypothesis and a thorough examination of the causes of the bias is needed.

Figure 11: Age of subjects in the dataset by race
*We had to re-code the age variable as the dataset provided us only with the age decade of the shooting crime participant. 0=0-20, 1=20-30, 2=30-40, 3=40-50…etc. up to 7. The figure displays the mean age of each race group using this method.
Conclusion and policy recommendations
In this analysis, we sought to answer the research question of whether the SSL algorithm for predictive policing employed in Chicago to identify the perpetrators and the victims of shooting incidents shows signs of a racial bias. We hypothesised based on previous controversies with predictive policing employed in other cities and contexts that the algorithm might be suffering from racial discrimination.
The results of our analysis seem to point in a direction confirming this hypothesis. Using and ranking Chicago’s racially segregated districts as proxies for real-world shooting incidents by race we found that the risks of shooting incidents in predominantly Hispanic districts were highly overestimated by the SSL algorithm compared to the real-world data. At the same time, the risk of predominantly Black districts was highly underestimated. Risk of White districts was accurately predicted. We therefore found evidence for negative racial discrimination against Hispanics and positive racial discrimination against Blacks in Chicago.
However, these results should not be considered as a final proof that the algorithm is racially biased as our research faced significant limits. Lacking access to the algorithm’s code and real-world data about the racial profiles of the perpetrators and victims of shooting incidents, we were forced to make several serious assumptions and approximations potentially skewing the result. The primary objective of the analysis is thus rather to point towards a possible fruitful research direction and serve as the basis for future research examining the racial bias of the SSL algorithm in depth.
Nevertheless, some general lessons about predictive policing can be drawn from the analysis. We should engage in a much broader dialogue with and reflection about the link between algorithms and their capacity to understand causality, which is and should probably remain a human feature. As the research has shown, predictive algorithms are not enough to consider preventing risk from reality, and should only serve as a complementary tool for traditional policing practices. Furthermore, considering the fact that such algorithms mostly rely on statistical models and focus on correlations, the insight of social scientists in designing the algorithms is desirable to provide the theoretical basis and to help identify potential biases and unbalance in such systems.
References
Akpinar, N.-J., De-Arteaga, M. and Chouldechova, A. (2021) ‘The effect of differential victim crime reporting on predictive policing systems’, in Proceedings of the 2021 ACM Conference on Fairness, Accountability, and Transparency. FAccT ’21: 2021 ACM Conference on Fairness, Accountability, and Transparency, Virtual Event Canada: ACM, pp. 838–849. doi:10.1145/3442188.3445877.
Bachner, J. (2014) ‘Predictive Policing: Preventing Crime with Data and Analytics’, p. 5.
City of Chicago. (2021). Strategic Subject List - Historical. City of Chicago Data Portal. https://data.cityofchicago.org/Public-Safety/Strategic-Subject-List-Historical/4aki-r3np
City of Chicago. (2021). Violence Reduction - Victims of Homicides and Non-Fatal Shooting. City of Chicago Data Portal. https://data.cityofchicago.org/Public-Safety/Violence-Reduction-Victims-of-Homicides-and-Non-Fa/gumc-mgzr
City of Chicago. (2021). Boundaries - Community Areas. City of Chicago Data Portal. https://data.cityofchicago.org/Facilities-Geographic-Boundaries/Boundaries-Community-Areas-current-/cauq-8yn6
City of Chicago. (2021). Boundaries - Police Districts. City of Chicago Data Portal. https://data.cityofchicago.org/Public-Safety/Boundaries-Police-Districts-current-/fthy-xz3r
Díaz, Á. (2021) ‘Data-driven policing’s threat to our constitutional rights’, Brookings, 13 September. Available at: https://www.brookings.edu/techstream/data-driven-policings-threat-to-our-constitutional-rights/ (Accessed: 2 December 2021).
Ferguson, A.G. (2017) The Police Are Using Computer Algorithms to Tell if You’re a Threat, Time. Available at: https://time.com/4966125/police-departments-algorithms-chicago/ (Accessed: 2 December 2021).
Haskins, C. (2019) Dozens of Cities Have Secretly Experimented With Predictive Policing Software. Available at: https://www.vice.com/en/article/d3m7jq/dozens-of-cities-have-secretly-experimented-with-predictive-policing-software (Accessed: 2 December 2021).
Heaven, W.D. (2020) Predictive policing algorithms are racist. They need to be dismantled., MIT Technology Review. Available at: https://www.technologyreview.com/2020/07/17/1005396/predictive-policing-algorithms-racist-dismantled-machine-learning-bias-criminal-justice/ (Accessed: 2 December 2021).
Heaven, W.D. (2021a) Predictive policing is still racist—whatever data it uses, MIT Technology Review. Available at: https://www.technologyreview.com/2021/02/05/1017560/predictive-policing-racist-algorithmic-bias-data-crime-predpol/ (Accessed: 2 December 2021).
Heaven, W.D. (2021b) Training data that is meant to make predictive policing less biased is still racist MIT Technology Review. Available at: https://www.technologyreview.com/2021/02/05/1017560/predictive-policing-racist-algorithmic-bias-data-crime-predpol/ (Accessed: 2 December 2021).
Heilweil, R. (2020) Why we don’t know as much as we should about police surveillance technology, Vox. Available at: https://www.vox.com/recode/2020/2/5/21120404/police-departments-artificial-intelligence-public-records (Accessed: 2 December 2021).
Hunt, P., Saunders, J.M. and Hollywood, J.S. (2014) Evaluation of the Shreveport predictive policing experiment. Santa Monica, CA: RAND Corporation.
Lum, C., Koper, C.S. and Telep, C.W. (2011) ‘The Evidence-Based Policing Matrix’, Journal of Experimental Criminology, 7(1), pp. 3–26. doi:10.1007/s11292-010-9108-2.
Meijer, A. and Wessels, M. (2019) ‘Predictive Policing: Review of Benefits and Drawbacks’, International Journal of Public Administration, 42(12), pp. 1031–1039. doi:10.1080/01900692.2019.1575664.
Mohler, G.O. et al. (2015) ‘Randomized Controlled Field Trials of Predictive Policing’, Journal of the American Statistical Association, 110(512), pp. 1399–1411. doi:10.1080/01621459.2015.1077710.
Rob Paral & Associates. (n.d.). Chicago Community Area Data. https://robparal.com/chicago-data/
Ryan-Mosley, T. and Strong, J. (2020) The activist dismantling racist police algorithms MIT Technology Review, MIT Technology Review. Available at: https://www.technologyreview.com/2020/06/05/1002709/the-activist-dismantling-racist-police-algorithms/ (Accessed: 2 December 2021).
Saunders, J., Hunt, P. and Hollywood, J.S. (2016) ‘Predictions put into practice: a quasi-experimental evaluation of Chicago’s predictive policing pilot’, Journal of Experimental Criminology, 12(3), pp. 347–371. doi:10.1007/s11292-016-9272-0.
Tayebi, M.A. and Glässer, U. (2016) Social Network Analysis in Predictive Policing. Cham: Springer International Publishing (Lecture Notes in Social Networks). doi:10.1007/978-3-319-41492-8.
Uchida, C.D., Ph.D. (2009) ‘A National Discussion on Predictive Policing: Defining Our Terms and Mapping Successful Implementation Strategies’, National Institute of Justice, (NCJ 230404), p. 10.